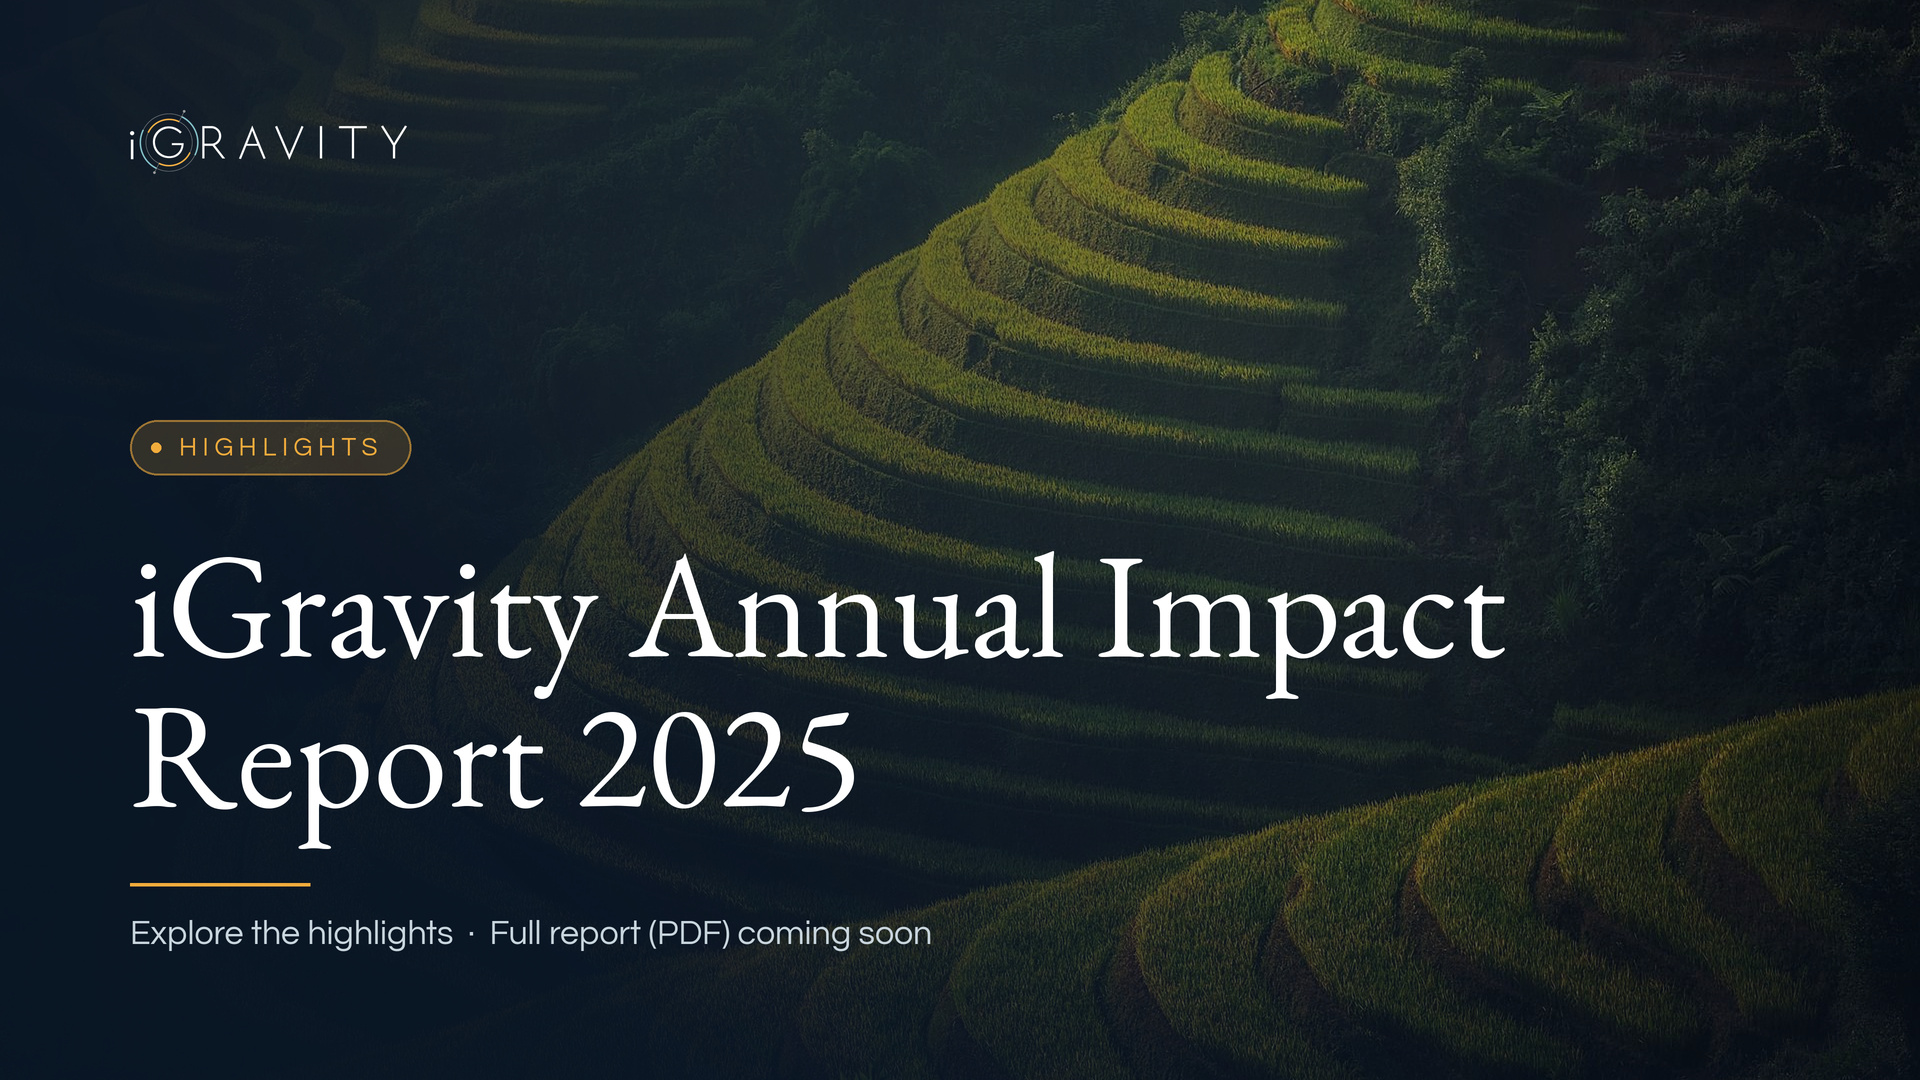
For the first time, we’re bringing together the results across the mandates we manage and our advisory work in one annual impact report. Today, we’re sharing the highlights through a new interactive report, ahead of the full PDF publication.
Since iGravity was founded in 2017, our work has focused on connecting capital with enterprises and initiatives that improve livelihoods, build more inclusive economies, and strengthen nature and climate resilience in emerging markets. Too often, businesses working towards these goals struggle to access the capital they need, while promising ideas remain disconnected and partnerships fall short of their potential.
Our work across investment management and advisory is a response to this challenge. Until now, the impact of our different mandates has largely been reported separately. The iGravity Annual Impact Report 2025 brings these results together, covering BALIM Investments, the Refugee Investment Facility (RIF), the Impact-Linked Finance Fund and our Multi-Manager strategies, alongside our advisory work.
The report is aligned with the Impact Reporting Norms developed by Impact Frontiers, providing a common basis for how we measure and communicate our results.
A year of growth
In 2025, the enterprises and funds supported through our work reached 3.86 million individuals across emerging markets.
We report our results across three thematic pillars that guide our investment activities.
Livelihoods
Access to essential services and opportunities | SDGs 1, 2, 3 and 4
- 239,098 learners reached with education services
- 169,785 people with improved access to healthcare
Inclusive Economies
Entrepreneurship, dignified work and fewer inequalities | SDGs 5, 8 and 10
- 321,023 SMEs financed
- 126,795 jobs supported across emerging markets
Nature and Climate Resilience
Resilient ecosystems, climate action and clean energy | SDGs 7, 13 and 15
- 102,768 hectares under sustainable management
- 9.0 million tonnes of CO₂e avoided or reduced
Compared with 2024, the results show growth across several areas:
- Individuals reached increased by 16%, from 3.3 million to 3.86 million
- Three times as many learners reached on an attributed basis
- Fourfold growth in land under sustainable management, reaching 102,768 hectares
- USD 66.1 million in capital raised across our four mandates by the end of 2025, an increase of 27% year on year
The enterprises behind the numbers
Behind these figures are businesses working to address specific challenges in their communities and markets.
In Senegal, food processor Kumba worked with BALIM to organise around 4,140 producers into four new cooperatives. Of these, 1,000 now deliver directly to Kumba rather than through intermediary traders.
In Uganda, agribusiness Okeba used a loan from RIF to expand its work with refugee farmers, creating 579 decent work opportunities for refugees and members of host communities.
In Tanzania, Upendo Honey expanded into remote Miombo woodlands, bringing 1.19 million hectares of at-risk forest under structured honey sourcing. Average incomes in its existing communities more than doubled.
In Lebanon, education technology enterprise Kamkalima nearly tripled its verified reach among vulnerable learners.
The report also looks at where progress remains incomplete. At Kumba, the extent to which farmers have adopted training is still being assessed. At Upendo Honey, women account for just 7% of active suppliers. These findings are an important part of understanding the results, helping us identify where further progress is needed.
Understanding our contribution
Throughout the report, we present each indicator on two bases: exposure and attribution.
Exposure shows the full reach of the businesses and funds we finance. Attribution shows the share of those results reasonably attributable to iGravity, weighted by our share of financing.
Both perspectives matter. Exposure shows the wider results achieved by the businesses and funds we support. Attribution gives a more specific view of the contribution associated with our financing.
Presenting both helps distinguish between the scale of the results and the share we can reasonably claim.
A broader view with more to come
Bringing these results together gives us a clearer picture of our work across investment mandates and advisory engagements. It also helps us see where our reporting is developing and where there is room to improve. Some frameworks and disclosures are still maturing, and we will continue to refine them as we report on our progress.
We’re also sharing the report in a new format this year. The interactive microsite brings the highlights together in one place, allowing readers to switch between exposure and attributed figures, read the foreword from our CEO and Head of Impact, and explore the case studies in more detail.
This is the first look. The full iGravity Annual Impact Report 2025, including detailed data tables, methodology and additional case studies, will follow as a PDF.
To our team, partners, investors, funders, advisory clients, and above all the entrepreneurs and communities we work alongside, thank you for being part of this work.